
Summary
I've been a big fan of Pi-hole for DNS filtering on the home network. It maintains a list of known "bad" domains, e.g. malware, advertisements, telemetry sites, etc. If it sees a DNS request to one of these domain, it returns a dummy address. This prevents the request from loading regardless of the application being used. Best of all, it's device agnostic since it's operating at the DNS level.

Configuring Pi-hole for Logging
This is written with the assumption that you're using a Debian-based distro. In this case I'm using Ubuntu, but the instructions should be the same for Raspbian. The other assumption is that you've already configured Pi-hole and it's working correctly. These are the additional steps to enable extensive DNS logging.
First, we'll make a minor change in Pi-hole for "extended" logging. We'll then restart the Pi-hole service.
sudo sh -c 'echo "log-queries=extra" > /etc/dnsmasq.d/99-pihole-log-facility.conf'
sudo /etc/init.d/pihole-FTL restartNext we'll modify the rsyslog configuration to read the logs and send them to another syslog destination, i.e. Elasticsearch.
sudo vi /etc/rsyslog.d/90-pihole.conf

### Add the following to the file.
module(load="imfile" PollingInterval="10")
# PiHole
input(type="imfile"
  File="/var/log/pihole.log"
  Tag="pihole"
  Severity="info"
  Facility="local7"
)
local7.info @your.elasticsearch.host:514At this point we just need to restart rsyslog.
sudo service rsyslog restartConfiguring Logstash to Parse Pi-hole Logs
Enabling GeoIP Lookups
MaxMind changed their licensing a while back, so you'll need to create a free account on their site to download to GeoIP database:
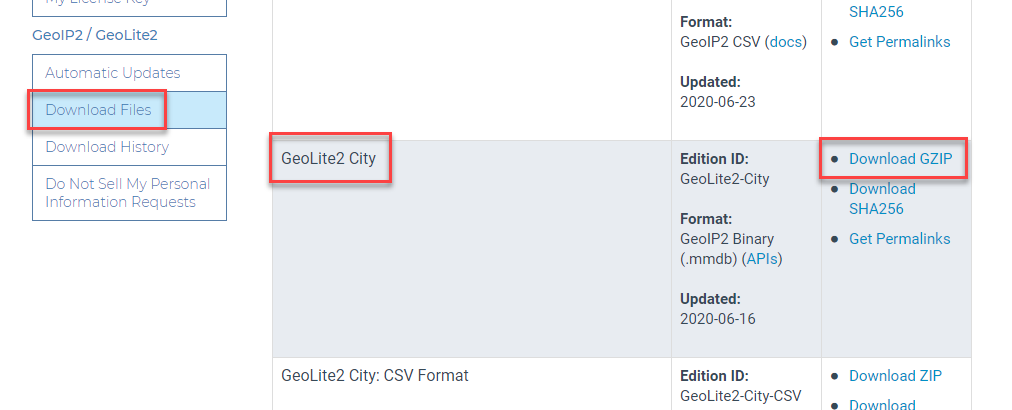
Once you have you account created, go to the user portal and click on Download Files under the GeoIP2 / GeoLite2 section. You'll want the GeoLite2 City database. Click on the link to download the the GZIP.
You'll then want to transfer this file over to the host running Logstash, which is likely the same host you have Elasticsearch installed. We'll extract the file and move it to the correct location once it's been copied over:
sudo mkdir -p /var/lib/GeoIP/
tar vzxf GeoLite2-City_20200616.tar.gz
sudo cp GeoLite2-City_20200616/GeoLite2-City.mmdb /var/lib/GeoIP/Adding the Pi-hole Parser to Logstash
Keep in mind that I'm using the default install folders for Logstash. You might need to change these if you've done any customization. Another assumption is that you've already got Logstash configured to ingest syslog. For example:
#tcp syslog stream via 1514
input {
  tcp {
    type => "syslog"
    port => 1514
  }
}
#udp syslogs stream via 5140
input {
  udp {
    type => "syslog"
    port => 1514
  }
}
Assuming the above is correct, you'll need to add a configuration file for Logstash to parse the logs and perform GeoIP lookups.
sudo vi /etc/logstash/conf.d/30-pihole.conf

### Add the following to the file.
filter {
  if [message] =~ /(gravity\.list|regex\.list|\/([0-9]+)\sreply\s)/ {
    grok {
      break_on_match => false
      match => [ "message", "\s%{IP:src_ip}\/%{POSINT:src_port}\s\/etc\/pihole\/(gravity\.list|regex\.list)\s(?<dnsbl_fqdn>.*?)\sis\s" ]
      match => [ "message", "\s%{IP:src_ip}\/%{POSINT:src_port}\s\/etc\/pihole\/(gravity\.list|regex\.list)\s.*(?<dnsbl_tld>\..*?\..*?)\sis\s" ]
      match => [ "message", "\s%{IP:src_ip}\/%{POSINT:src_port}\sreply\s(?<dns_fqdn>(.*?))\sis\s" ]
      match => [ "message", "\s%{IP:src_ip}\/%{POSINT:src_port}\sreply\s.*?\sis\s%{IP:dst_ip}" ]
      overwrite => [ "src_ip" ]
      overwrite => [ "src_port" ]
      overwrite => [ "dst_ip" ]
    }
    mutate {
      add_tag => [ "pihole" ]
    }
    geoip {
      add_tag => [ "GeoIP" ]
      source => "dst_ip"
      database => "/var/lib/GeoIP/GeoLite2-City.mmdb"
    }
  }
}
As the last step, you'll need to restart Logstash:
sudo service logstash restartAt this point the Pi-hole logs should be parsing, along with GeoIP information being added to the incoming events.
Viewing the Data in Kibana
There are a ton of searches and visualizations that can be done around the data, but I'll start with two basic ones: viewing the parsed data and leveraging the GeoIP information on a map.
Viewing the Parsed Data
The filter above added two tags to the data: GeoIP and pihole. This make searching much easier. You can just plug this into the search:
tags: geoip AND tags: piholeYou should get results similar to this:
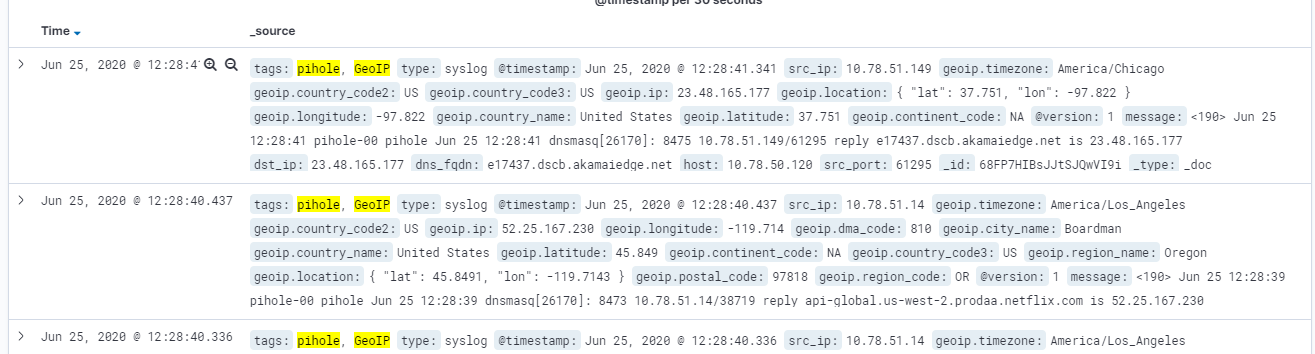
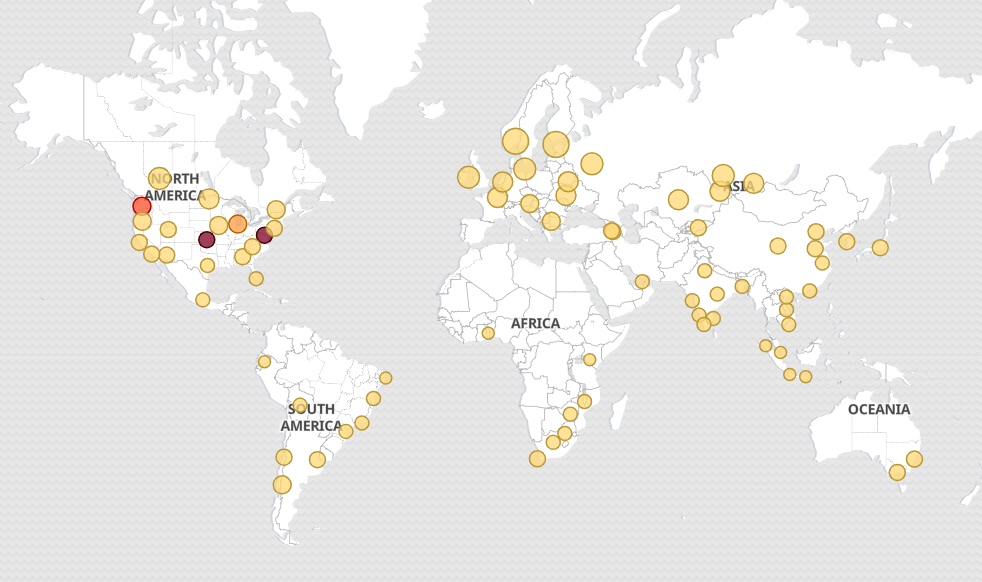
There is a ton of data added beyond the original message event. This ranges from the geoip.timezone to the geoip.country_name to the geoip.location. We're going to leverage the geoip.location to display the data on a map.
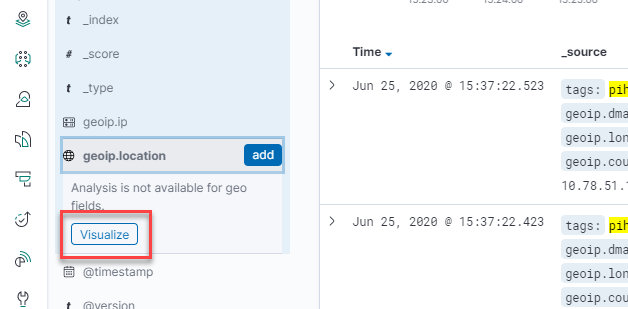
Leveraging the Data
You've got a ton of options since the data has been parsed and augmented, e.g. visualizations based on country, bar and pie charts around FQDNs, reports on the top blocked domains, etc. A quick-and-easy option is to simply click on the geoip.localtion field and then Visualize. You can change the appearance of the graph as needed.
Conclusion
Hopefully this guide was beneficial, and serves as an example of parsing out semi-structured data with Logstash. The Grok filters are a powerful tool for parsing out data once you get the hang of them. More information can be found here.