
Summary
One of the pain points of Elasticsearch has always been Elasticsearch DSL. The queries never seem to make sense to me, they're always incorrect when I write them, and I've never found a decent "before and after" for UI queries versus the DSL. A co-worker pointed me to a button in Kibana that I'd seen a million times but stopped noticing: Inspect. It'll show you the DSL query from the query that you'd built in the Kibana UI.
Details
Build the Query
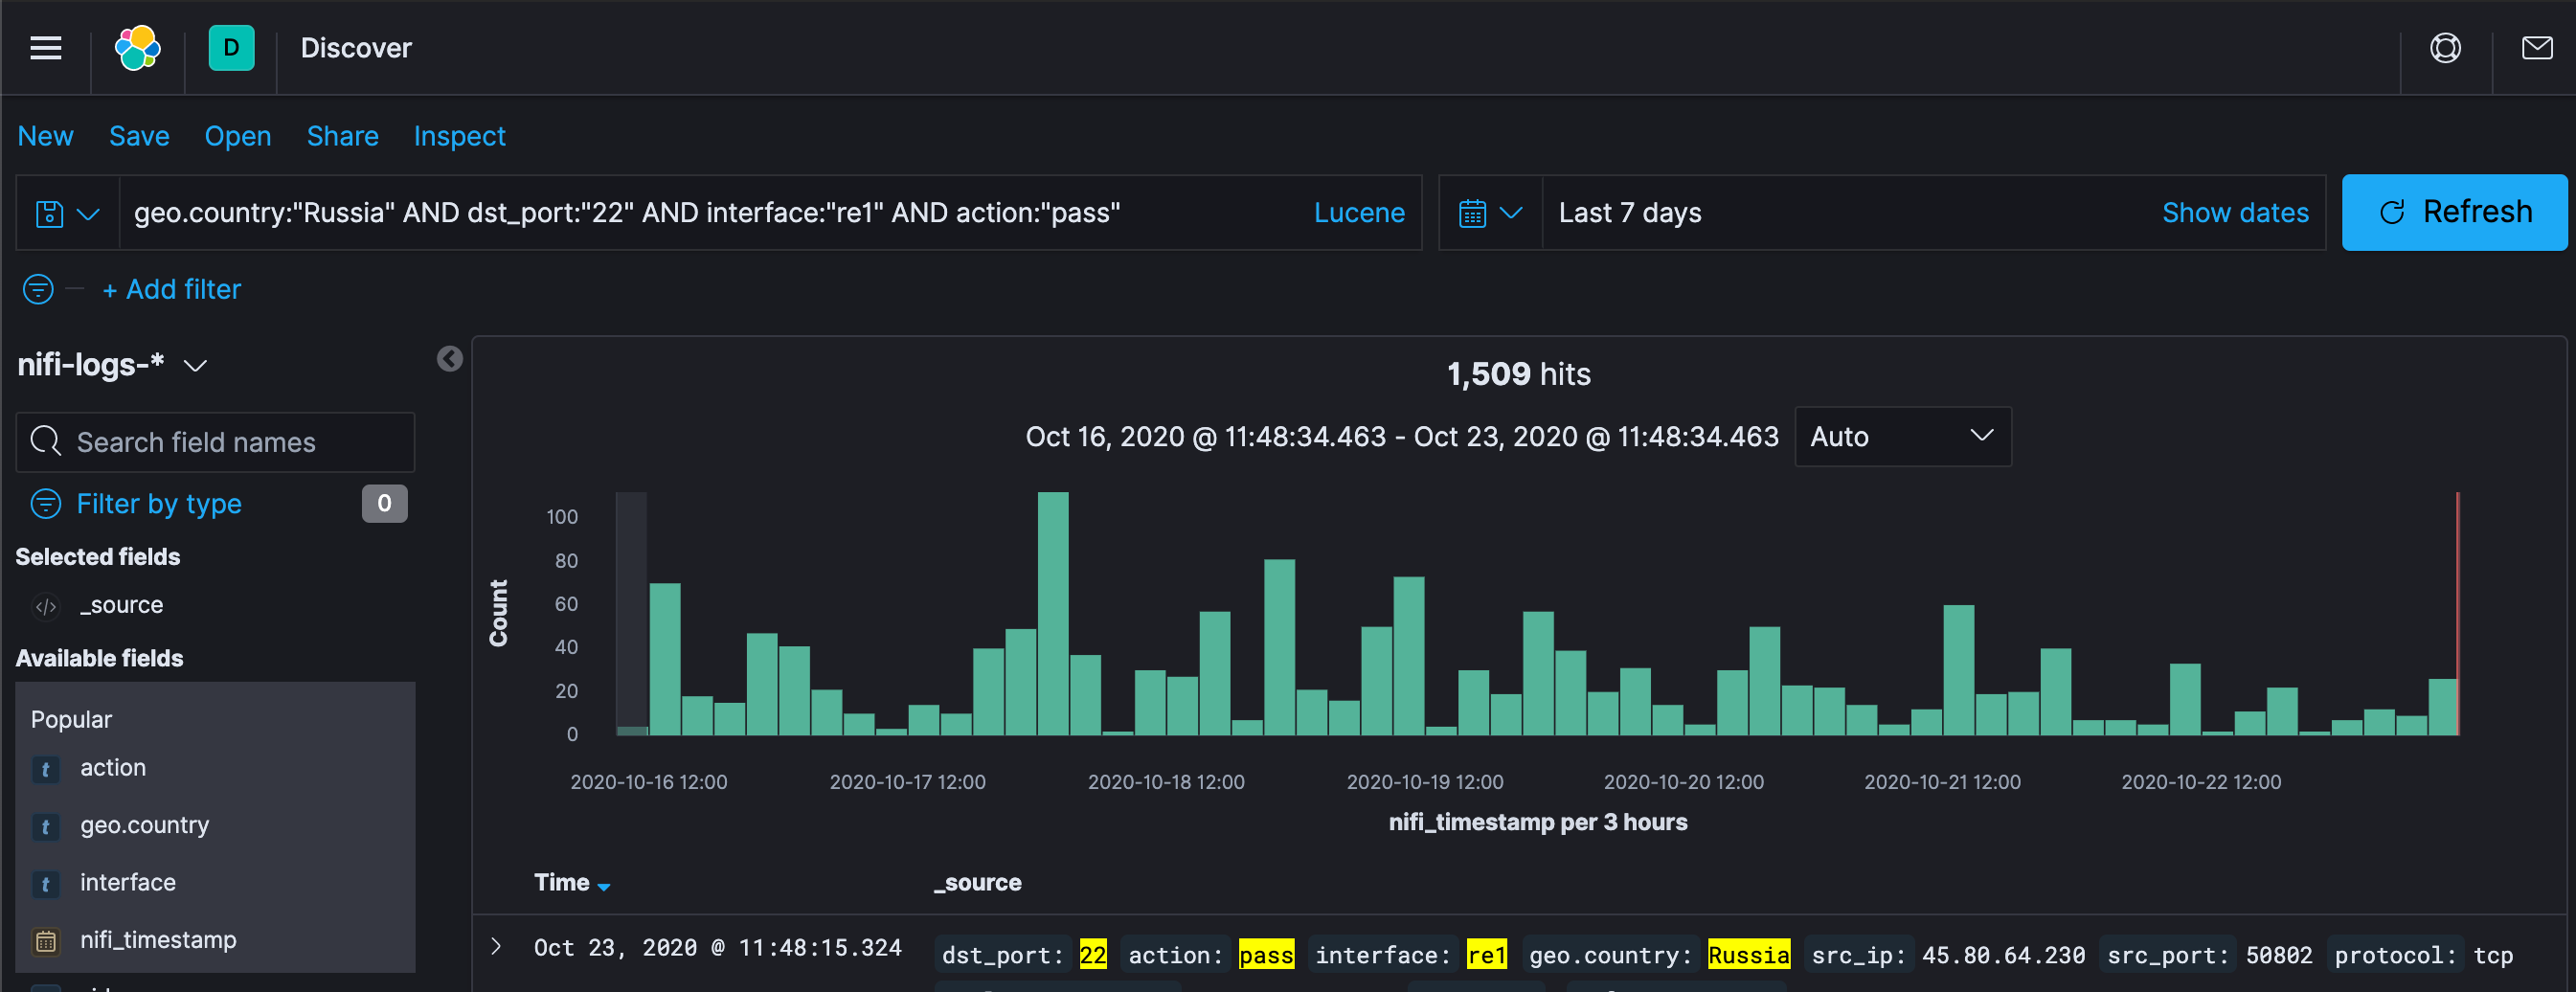
The first step is easy: go into the Kibana UI and build the query like you normally would. In this case I'm doing a search over the last 7 days for anything originating from Russia where the destination port is 22. I've also thrown in a few other criteria just to make the DSL output slightly more complex.
geo.country:"Russia" AND dst_port:"22" AND interface:"re1" AND action:"pass"
Hello Vlad.
The Inspect Button
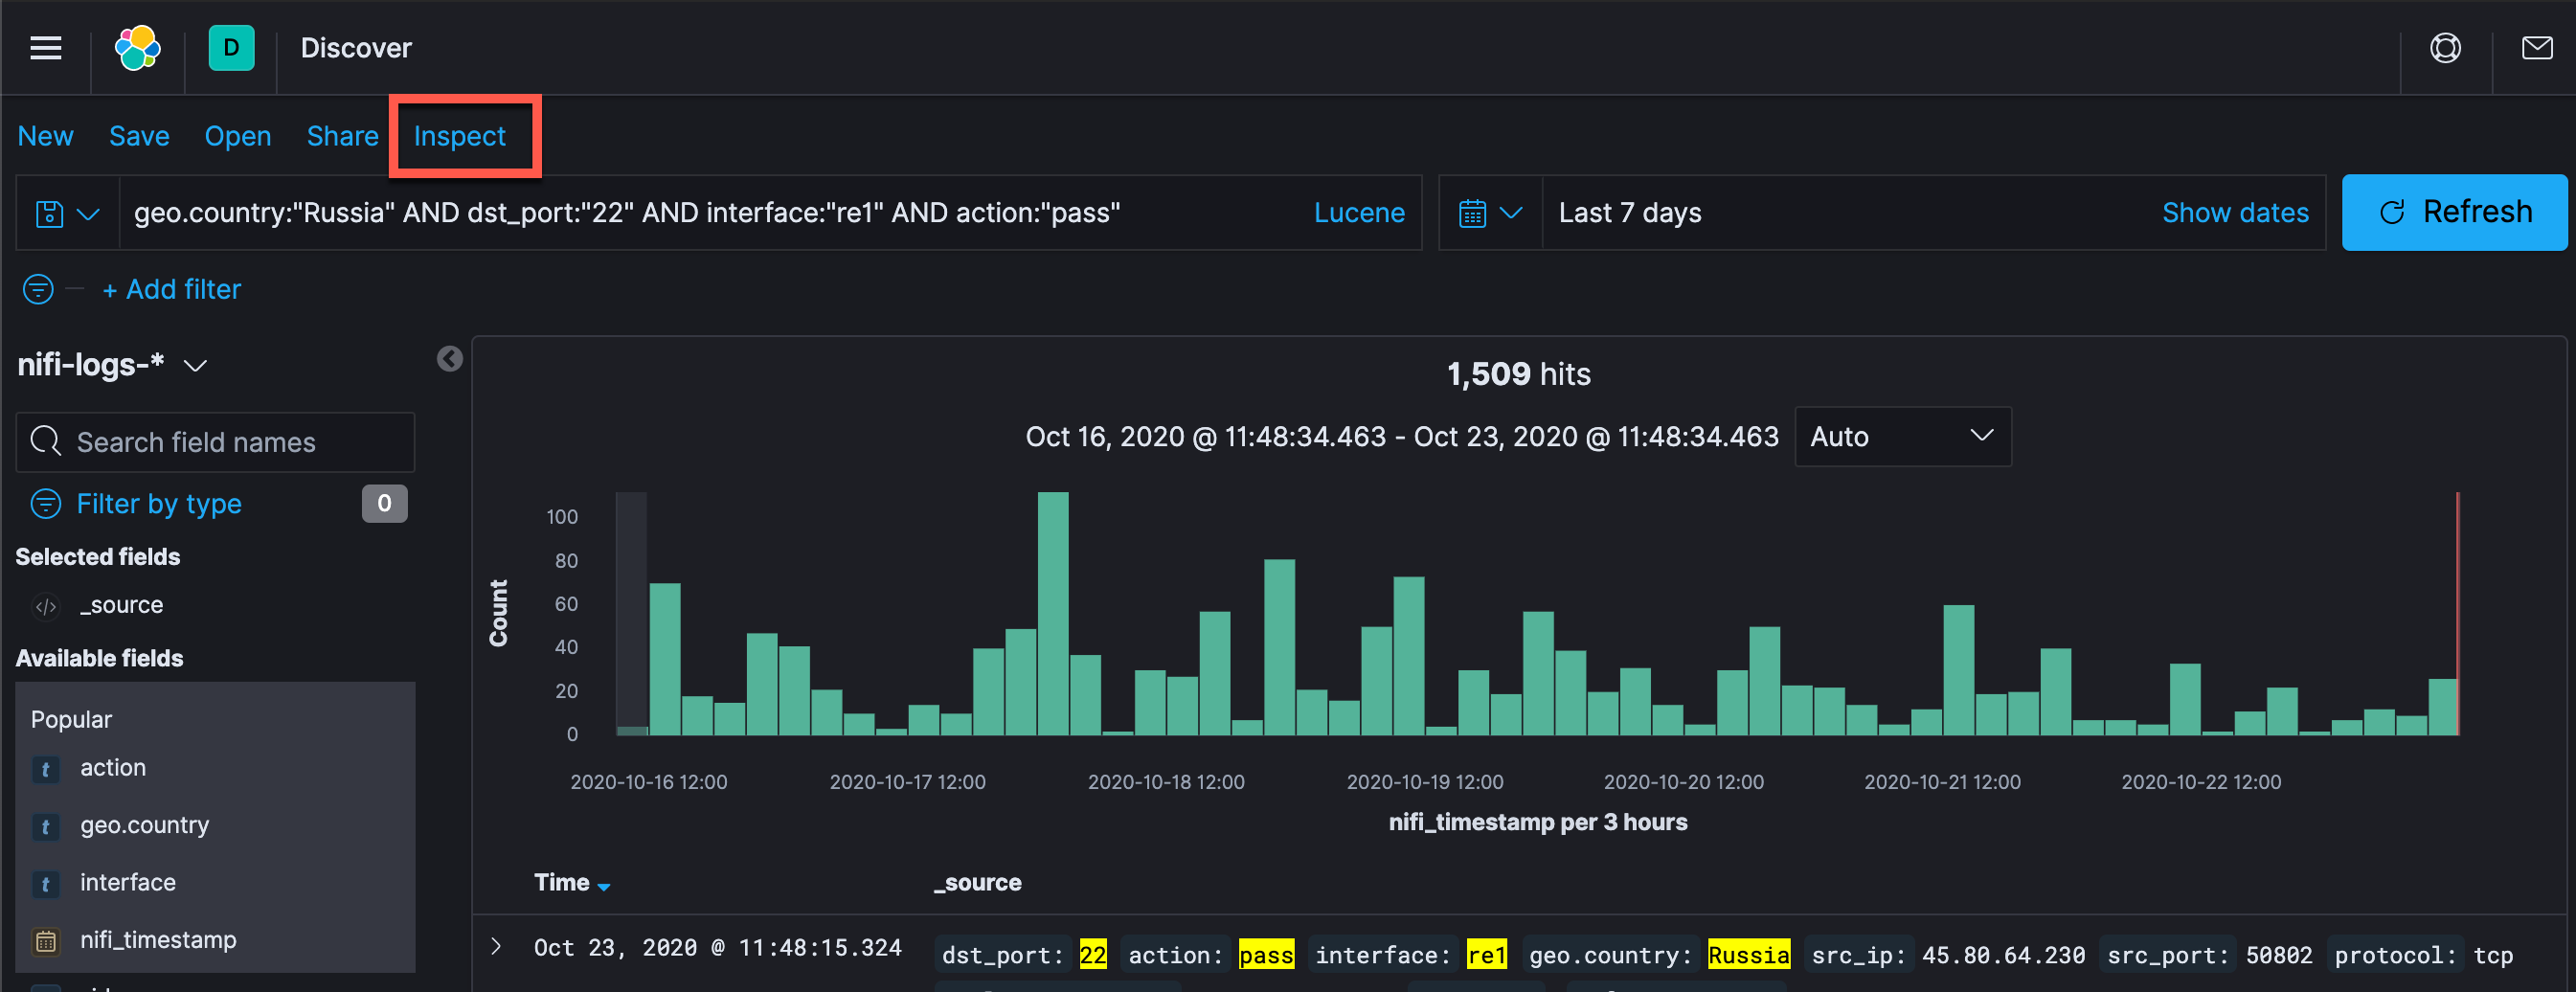
Next click the Inspect button that I somehow never noticed.
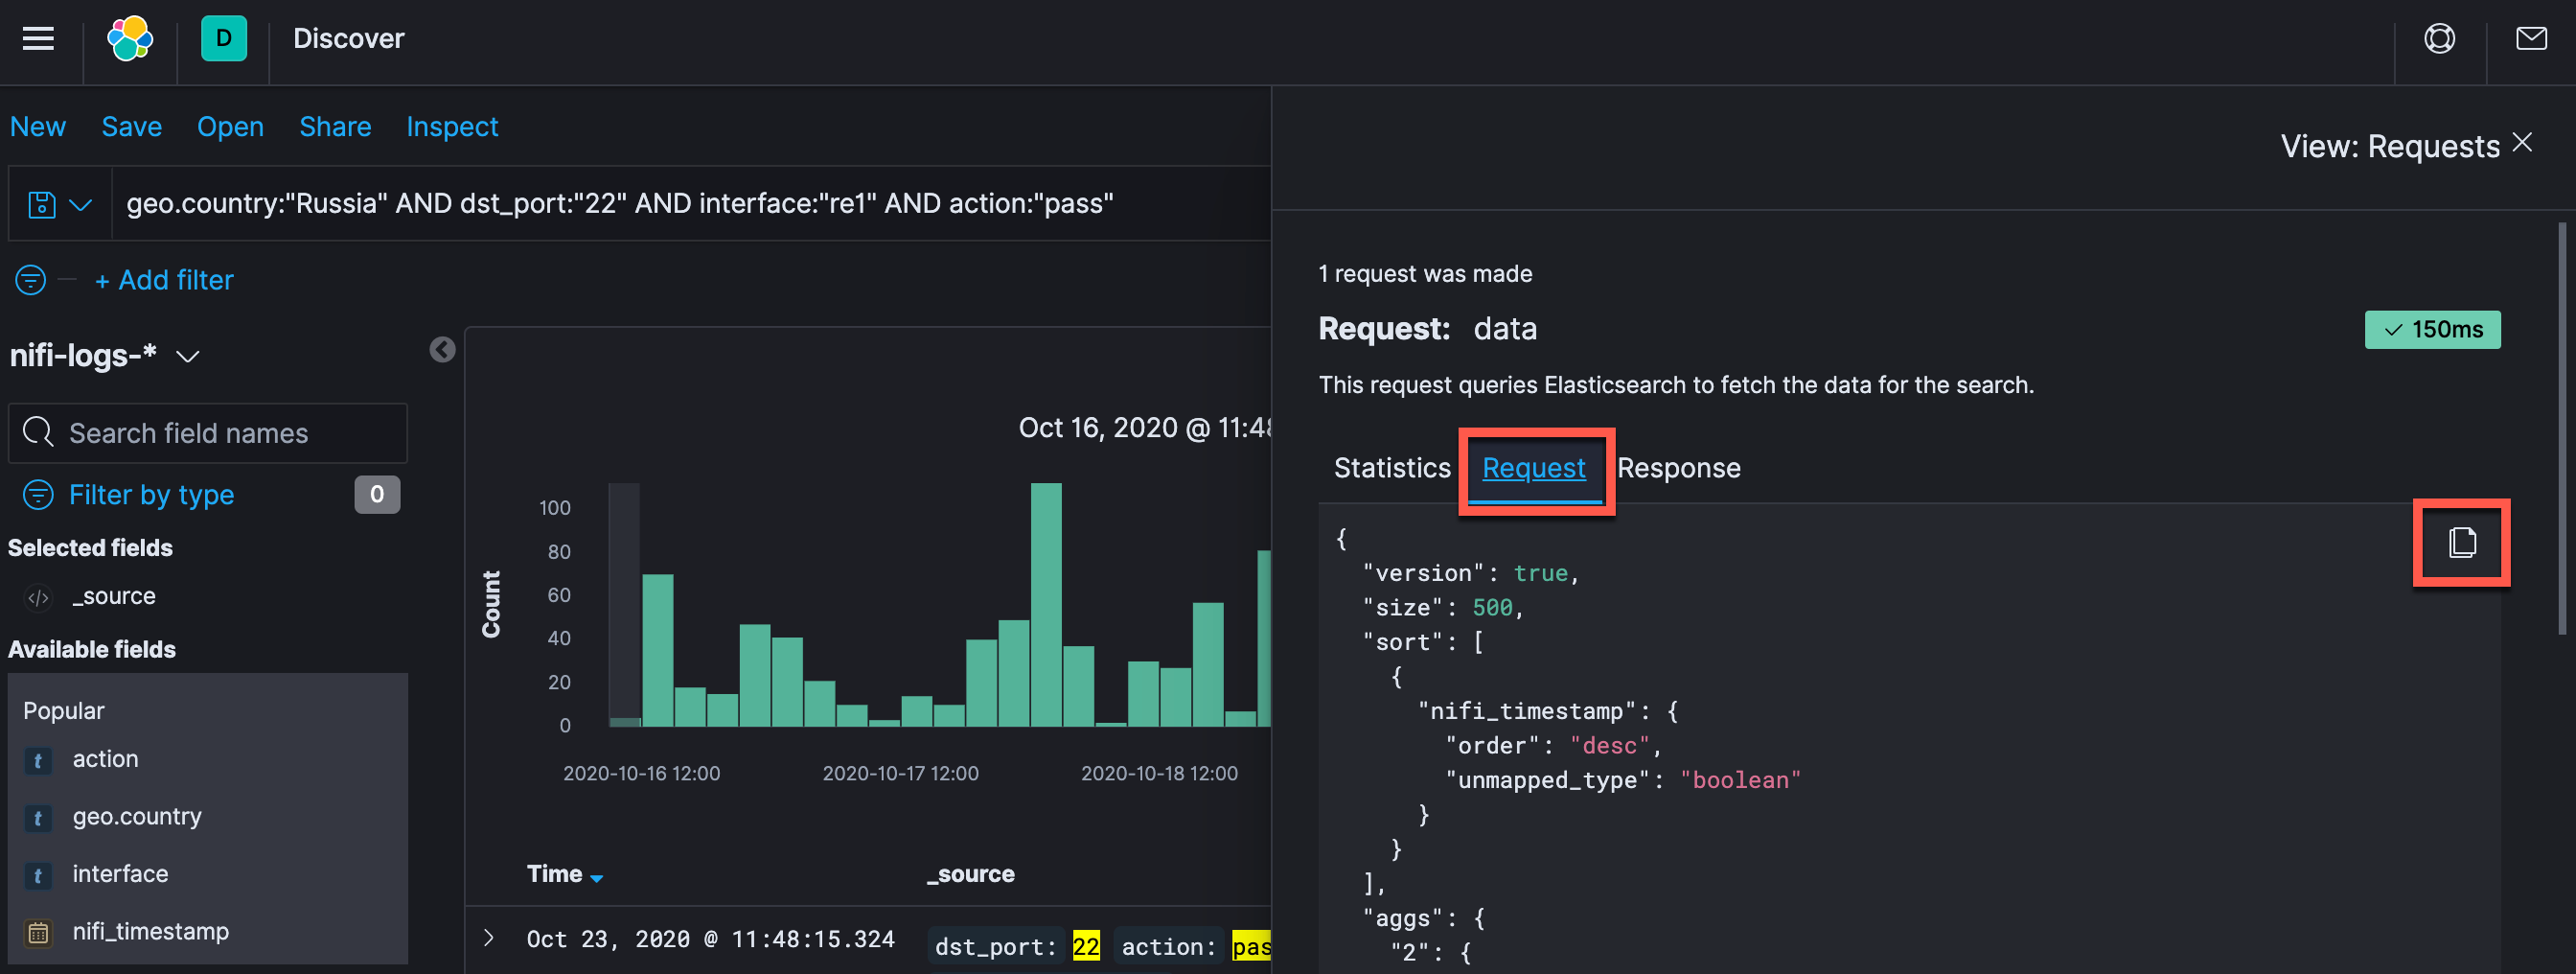
On the next screen, click the Request tab. This will show you the DSL that was used in the query. There's even a copy button to make life easier.
The DSL Query
...and here's the resulting DSL output, which is way less intuitive than the query I'd listed out at the beginning of the article.
{
  "version": true,
  "size": 500,
  "sort": [
    {
      "nifi_timestamp": {
        "order": "desc",
        "unmapped_type": "boolean"
      }
    }
  ],
  "aggs": {
    "2": {
      "date_histogram": {
        "field": "nifi_timestamp",
        "fixed_interval": "3h",
        "time_zone": "America/Detroit",
        "min_doc_count": 1
      }
    }
  },
  "stored_fields": [
    "*"
  ],
  "script_fields": {},
  "docvalue_fields": [
    {
      "field": "nifi_timestamp",
      "format": "date_time"
    }
  ],
  "_source": {
    "excludes": []
  },
  "query": {
    "bool": {
      "must": [
        {
          "query_string": {
            "query": "geo.country:\"Russia\" AND dst_port:\"22\" AND interface:\"re1\" AND action:\"pass\"",
            "analyze_wildcard": true,
            "time_zone": "America/Detroit"
          }
        }
      ],
      "filter": [
        {
          "range": {
            "nifi_timestamp": {
              "gte": "2020-10-16T15:48:34.313Z",
              "lte": "2020-10-23T15:48:34.313Z",
              "format": "strict_date_optional_time"
            }
          }
        }
      ],
      "should": [],
      "must_not": []
    }
  },
  "highlight": {
    "pre_tags": [
      "@kibana-highlighted-field@"
    ],
    "post_tags": [
      "@/kibana-highlighted-field@"
    ],
    "fields": {
      "*": {}
    },
    "fragment_size": 2147483647
  }
}
Conclusion
This was one of those "derp" moments when I considered the amount of time I'd spent trying to get DSL queries working. Hopefully this helps someone out.