Summary
You'll often find an abundance of different logging solutions in large environments. The application team might be using Product X, the network team is using Product Y, and the security team is using Product Z. The deployment of multiple logging platforms can quickly become problematic: they don't speak the same language and you often need to get data from one to the other. This guide will walk you through using Apache NiFi to query Elasticsearch, extract the original event, and send it to another platform in syslog format.
The Elasticsearch Instance
In this hypothetical scenario, the network team is sending all of their Pi-hole DNS logs to their Elasticsearch cluster. We'd like to export the logs into our platform to perform entity analytics against the data, specifically the logs with GeoIP information associated with them. The query results look like this:

The Lucene query itself is simple enough:
tags:geoip AND tags:piholeTo keep the load against their Elasticsearch cluster at a minimum, we're only going to be requesting 1 minute of data every minute. It's not quite real-time, but it's close enough for the intended purposes. Here's the modified Lucene query that only asks for the last minute of data:
tags:geoip AND tags:pihole AND @timestamp:[now-1m TO *]The data is stored in the logstash index, which is just an alias for whatever the most recent logstash index might be, e.g. logstash-2020.05.30-000014. Next we'll move onto configuring Apache NiFi.
Configuring Apache NiFi
Selecting the Processor
I'll preface this by saying I'm not an expert on Elasticsearch. There are a few different processors for extracting data from Elasticsearch, primarily FetchElasticsearch, JsonQueryElasticsearch, and QueryElasticsearchHttp. They all have their pros and cons that are beyond the scope of this article. However, for simplicity, we're going to use QueryElasticsearchHttp since it lets us use the same queries we'd find in the ELK UI.
QueryElasticsearchHttp
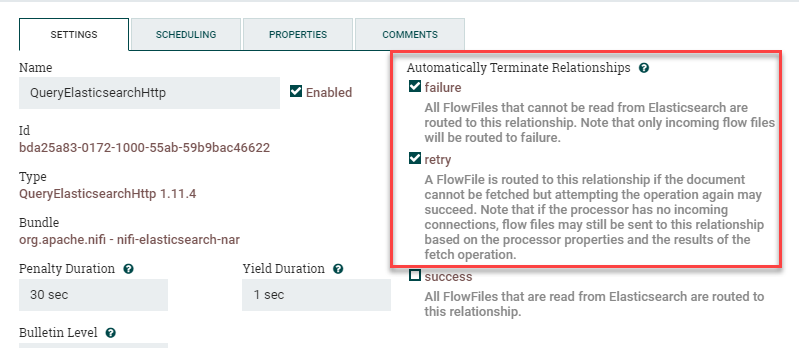
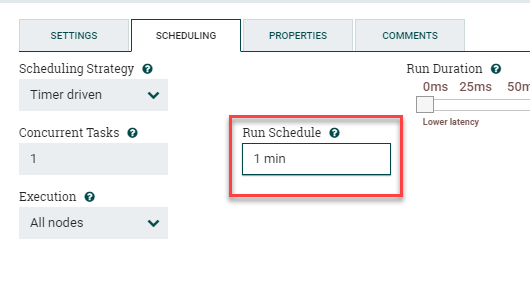
Start by dragging a QueryElasticsearchHttp processor onto the canvas. Go into Settings and check Failure and Retry under Automatically Terminate Relationships. Next we'll go to Scheduling and change the Run Schedule to 1 min instead of the default "0 sec". This tells the processor to only query Elasticsearch for new data every minute, otherwise by default it'll query as fast as possible and create a bunch of extremely unhappy Elasticsearch administrators.
Please note: it's critical to change this to something reasonable. You'll also want to change the Elasticsearch query to match that same interval. For example, if you've set the processor to run a query every 5 minutes, you'll want to change the query to include AND @timestamp:[now-5m TO *] so you're not missing any data.
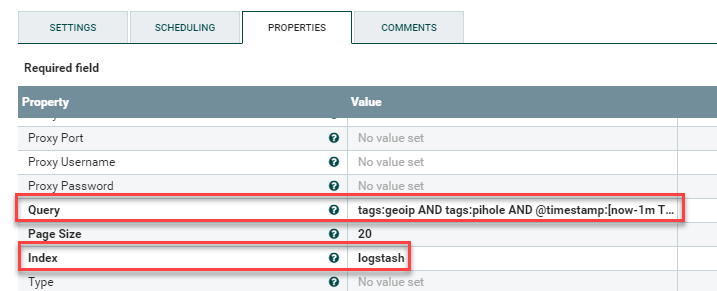
Next go to Properties and change the following values:
Elasticsearch URL: http://elastic:9200 [Replace with your hostname]
Query: tags:geoip AND tags:pihole AND @timestamp:[now-1m TO *]
Index: logstash
The result should look like this:
EvaluateJsonPath
Next we'll add the EvaluateJsonPath processor. This allows us to extract out fields from the resulting JSON. This is important since the only part of the result we care about is the original event. Otherwise, you'd be sending this to your destination:

The only part of that event that we need is the message: field. Best of all, it's already a syslog event in the correct format, so we don't need to change anything after we've extracted it.
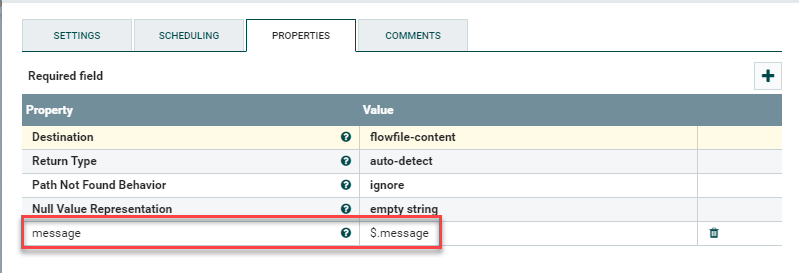
Drag a EvaluateJsonPath processor onto the canvas. Check Failure and Unmatched under Automatically Terminate Relationships. Next go to Properties, click the + symbol, and create a new property named message. Add $.message for the value. This means "start at the first stanza, go down to the message key, and grab all the data after that key. The end result will look like this:
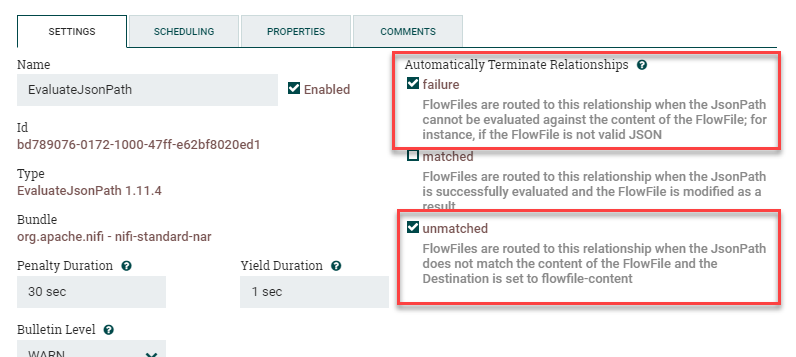

The $.message value will overwrite the contents of the flowfile with just the data from the original syslog event.
PutUDP
The last step is to drag a PutUDP processor onto the canvas. The settings for this are simple. Check Failure and Success under Automatically Terminate Relationships since this is the last stop for the data. Next go to Properties and plug in the Hostname and Port that you would like to send the extracted data to, e.g mysyslogserver.corp.internal and 514.

Connecting the Processors
At this point we're largely finished. We'll just need to connect the processors:
QueryElasticSearchHttp to EvaluateJsonPath: success
EvaluateJsonPath to PutUDP: matchedThe final result will look like this:
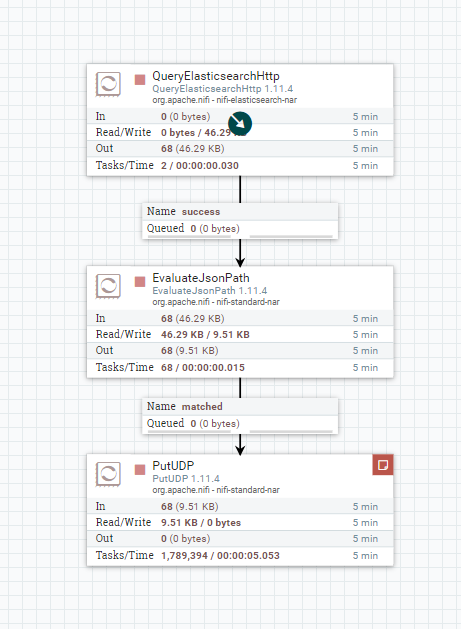
At this point you'll just need to click anywhere on the canvas so nothing is selected, right-click, and select Start to start the fetch and transform.
Conclusion
In just 3 processors we've successfully configured NiFi to fetch data from Elasticsearch, extract the original field, and send it back out as a syslog event. You can also download the template from here if you'd like to load it directly into Apache NiFi. I hope this helps and happy log collecting!
I've also published a video tutorial on this same topic:
