Summary
Splunk has a fairly robust API. However, you'll occasionally get into situations where you need the data exported out of Splunk as syslog. This guide walks you through connecting to Splunk with Apache NiFi, pulling data in batches from Splunk via the API, and sending it out as syslog from NiFi. Similar to the Elasticsearch tutorial, the data is near real-time. In this case, we'll have NiFi querying Splunk for 1 minute of data from 5 minutes prior, with the query executing every minute.
Configuration
NiFi Setup
This guide assumes you already have NiFi up and running. If not, I'd previously written a guide on how to get it installed. You can also do a quick and easy install with Docker.
GetSplunk Processor
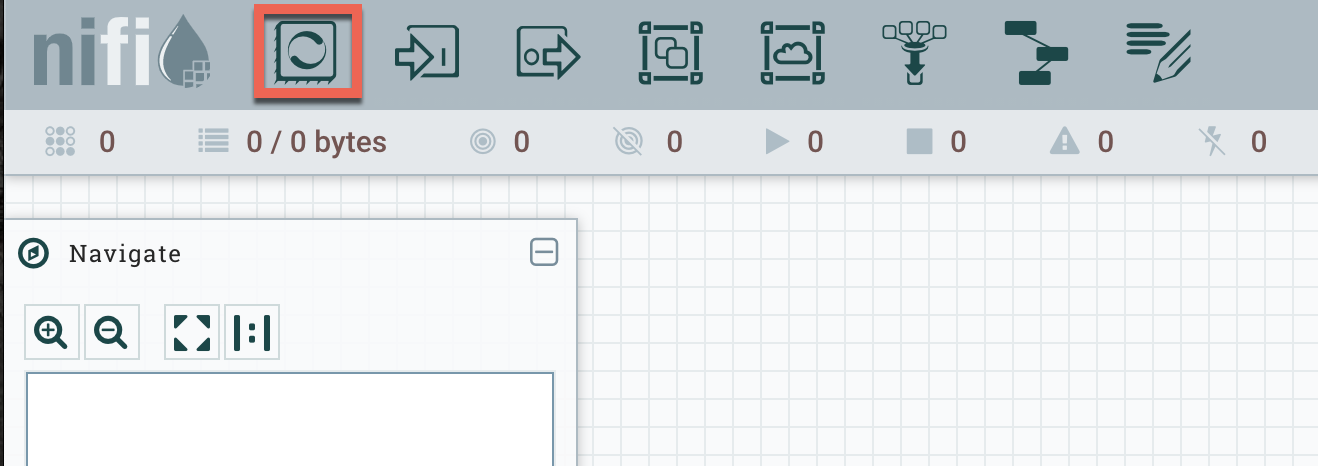
The first step is to configure the GetSplunk processor. Click on Processor in the top-left corner on the UI and drag it over to the canvas.
You'll then select GetSplunk from the list. Once the processor is on the canvas, double-click on it to access the settings. Keep in mind that we'll be running this every minute asking for 1 minute of data from 5 minutes prior. For example, if it's 12:10, then we'd be asking for the data from 12:04 - 12:05. The next minute we'd be asking for 12:05 - 12:06, then 12:06 - 12:07, etc.
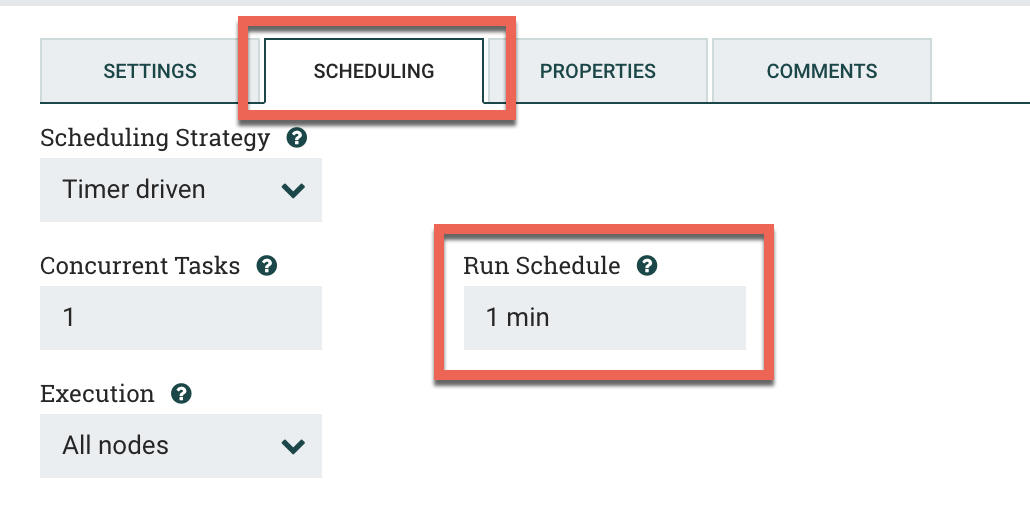
Under the Scheduling tab, put in 1 min for the Run Schedule.
Next click on the Properties tab. You'll want to plug in the following values. Keep in mind that my query is fairly simple: it just asks for everything in the syslog index on Splunk. You'll want to modify this for your environment.
Scheme: https
Hostname: searchhead.splunk.company.internal
Port: 8089
Query: search index="syslog"
Time Field Strategy: Event Time
Time Range Strategy: Provided
Earliest Time: -6m@m
Latest Time: -5m@m
Time Zone: UTC
Application:
Owner:
Token:
Username: yoursplunkusername
Password: yoursplunkpassword
Security Protocol: TLSv1_2
Output Mode: RAW
Click Apply at the bottom once you're finished. By default, this will come out as one giant blob of text. We'll split this up with the next processor.
For reference: if you wanted to pull an hour of logs every hour, e.g. batched logs, then you'd change the Earliest Time to -2h@h and the Latest Time to -1h@h. You'd then set the scheduling above so it runs every hour instead of every minute.
SplitText Processor
Next we'll use the SplitText processor to chop up the previous blob of data into individual events. Drag a SplitText processor onto the canvas and double-click it to access the settings.
First, click on the Settings tab. Check failure and original under Automatically Terminate Relationships. Why? We're going to drop everything except for the split data. We don't need anything else.
Next, click on the Properties tab and enter the following:
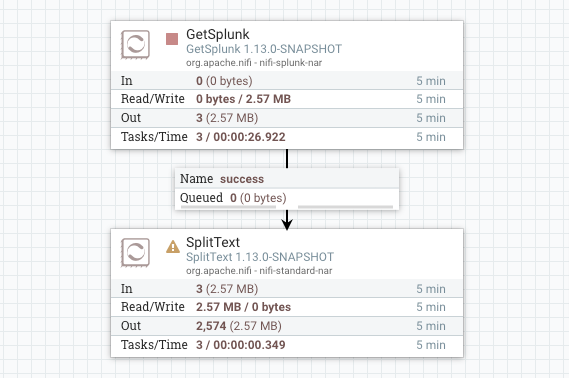
Line Split Count: 1The rest of the values can remain at the defaults. This tells NiFi to split each single line into an individual event. Click Apply when done. We'll now connect the GetSplunk processor to the SplitText processor. Draw a line between the two and click Add at the bottom of the pop-up. You'll end up with this:
Now that we have the individual events, we're going to send them to the PutUDP processor and redirect the events back out of NiFi.
PutUDP Processor
Drag a PutUDP processor to the canvas. Double-click again to open up the processor settings. Under the Settings tab, check the boxes next to Failure and Success under Automatically Terminate Relationships. This is the last processor in the flow, so we'll be dropping everything after it hits this processor.
Next click on the Properties tab. There isn't much to change here.
Hostname: syslogdestination.company.internal
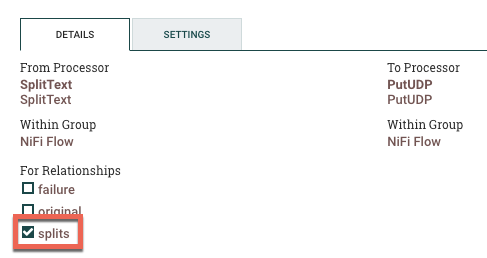
Port: 514Click Apply when done. Similar to above, you'll then connect the SplitText processor to the PutUDP processor. Select Splits under the For Relationships section when it pops up.
Enabling the Flow
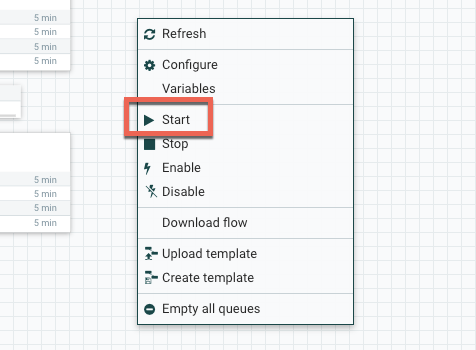
Finally, we'll need to enable everything we just created. Right-click anywhere on the blank canvas and select Start. Assuming there aren't any mistakes, the flow should fire up, start pulling data from Splunk, and streaming it back out in UDP.
Conclusion
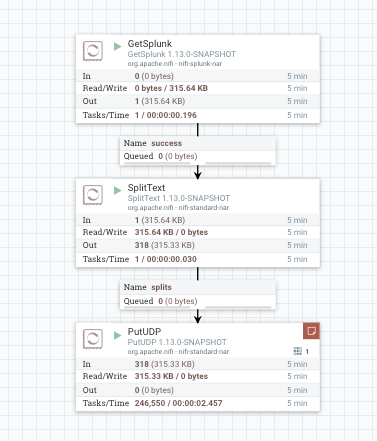
The final product should look something like this:
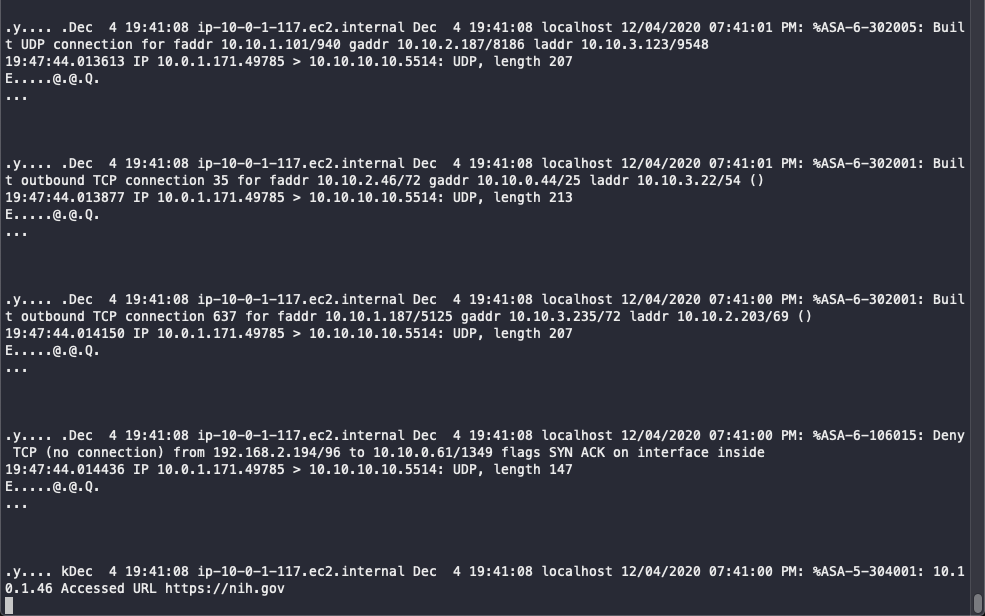
If we watch the output with tcpdump, we should see something like this: